When something is wrong: logs and metrics
Reading an environment's runtime logs and its CPU, memory and restart history - and knowing which of the two log sources you are looking at, because only one of them survives a restart.
Verified on August 13, 2026
Two tabs answer almost every "what is happening?" question about an environment: Metrics for how it is running, Logs for what it is saying. Neither requires a terminal, a cluster, or anyone from the platform.
Both are read-only, and both are available to a Viewer: watching an environment is not the same permission as changing it, and the person who first notices a problem is often not the person allowed to deploy.
Three numbers before anything else
The Metrics tab opens on three tiles, and they are worth reading in order.

- Status — how the environment is running, plus how many replicas are ready out of how many are wanted.
Runningwith1/1is healthy;1wanted and0ready means it is starting, or failing to. - Uptime — time since the last start. A number much smaller than you expected is the discovery that something restarted while you were not looking.
- Restarts — how many times the environment has restarted since it was created. This is the most informative number on the page. Zero is normal. A count that climbs on its own is a crash loop, and the reason is in the logs of the previous run.
If a message appears under the tiles, it is the platform's own explanation of an unhealthy environment, passed through unchanged.
CPU and memory, against their limits
Below the tiles, two charts — when usage history is available for this environment.
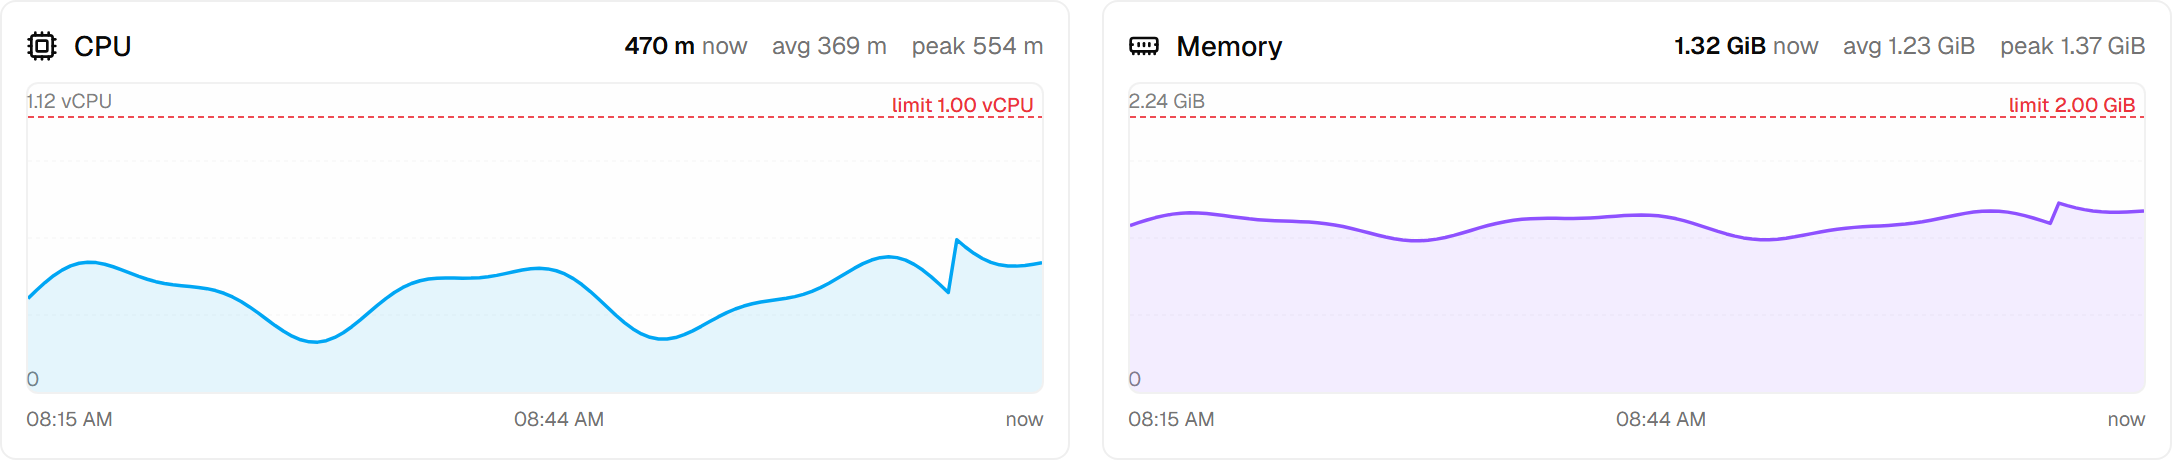
Each chart shows current, average and peak over the selected window, and draws the limit as a dashed line. That line is the point of the chart: an environment is not slow because CPU is high, it is slow because CPU is high relative to what it is allowed, and memory reaching its limit does not slow anything down — it kills the environment, which is what the restart counter above then records.
Four ranges are offered — 15 minutes, 1 hour, 6 hours, 24 hours — plus an absolute window when you know when something happened.
Where the numbers come from matters, and the panel says so:
| What is available | What you get |
|---|---|
| Full readings | History: the charts above. |
| Instant readings only | The current CPU and memory value, with no history and no chart. |
| None | The status tiles only, and the panel says so. |
The log tail
The Logs tab shows the environment's runtime output, near-real-time, with levels coloured: errors in red, warnings in amber, everything else quieter.
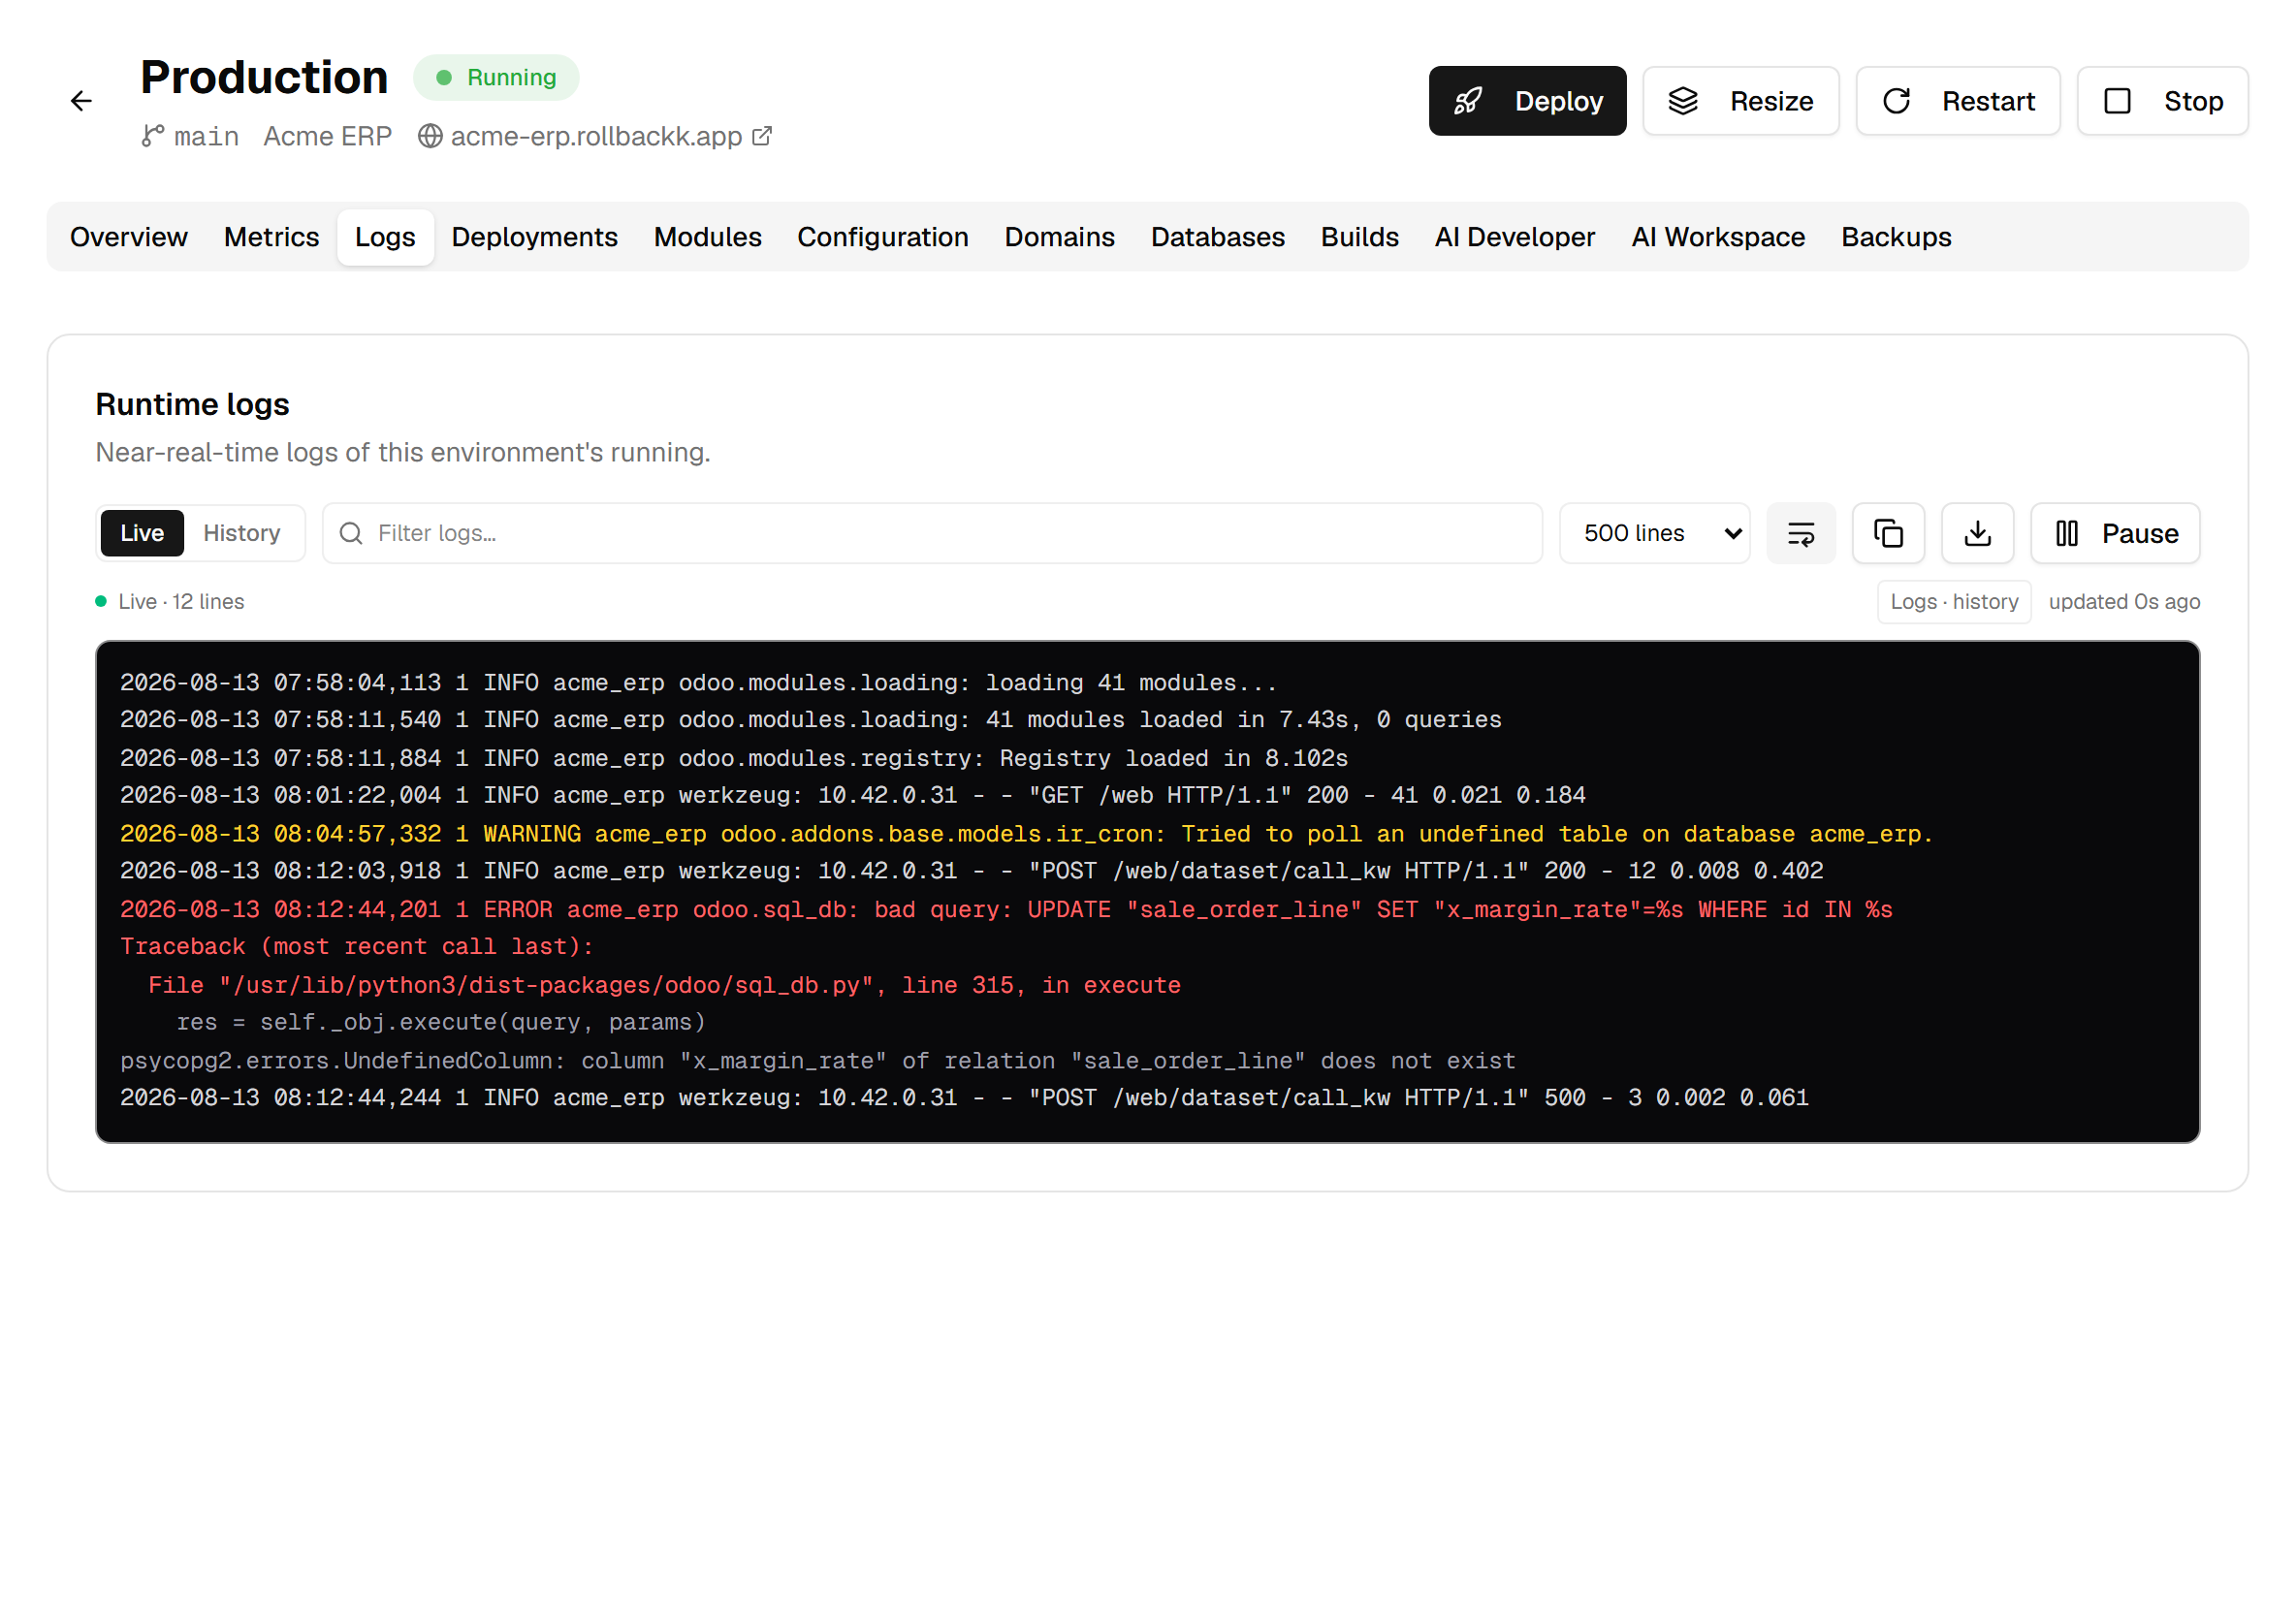
The controls are the ones you actually need while reading:
- Filter — matches are highlighted in place, and the line count updates so you can see how many.
- Tail size — 200 to 2000 lines.
- Pause — stops the auto-refresh so a line you are reading does not scroll away. It also stops polling entirely.
- Wrap, copy, download — the last one gives you a text file to attach to a bug report.
The view auto-follows new lines unless you scroll up; when it stops following, a button appears to jump back to the bottom.
Live or history: the distinction that matters
The badge at the top right of the log panel says which of two sources you are reading, and they do not offer the same guarantee.
Live is the running environment's own output. It is ephemeral: it belongs to that run, and a restart takes it with it. If an environment crashed and came back, the live tail shows you the logs of the healthy process that replaced the one you wanted to read.
History is stored separately from the environment itself. It survives restarts, which is exactly what you need after a crash — and it lets you ask for a window in the past rather than only the present.
The Live / History switch forces one or the other. In history mode you also get a time range, and an absolute window does not auto-refresh — a fixed slice of the past does not change, so it is not re-fetched.
When history is not available, the panel falls back to the live tail rather than showing nothing, and the badge changes accordingly. Check the badge before concluding that a log line does not exist: absent from the live tail only means absent since the last restart.
Reading a crash
The order that finds the cause fastest:
- Restarts on the Metrics tab. Rising? Something is killing the environment.
- Memory chart against its limit. Touching the line means the kill was the memory limit, and no log line will say so — the process was terminated, it did not fail.
- Logs in history mode, over a window that covers the restart. This is the only source that still holds what the stopped run said.
- Filter on
TracebackorERRORto jump to the failure, then read upwards: the interesting line is usually the request that preceded it.
If memory is flat and the logs end on a traceback, the fault is in the code, and the guide on modules covers the deploy-and-migrate loop that fixes it.